How to Read Japanese Candlesticks
in Trading: Beginner's Guide
Master japanese candlestick analysis: OHLC anatomy, body, wicks, and the 5 essential patterns to make better trading decisions.
You look at a trading chart and you see those green and red rectangles with lines sticking out? Welcome to the world of japanese candlesticks, the most widely used chart analysis tool by professional traders worldwide. In 2026, 78% of beginner traders who learn to read japanese candlesticks significantly improve their decisions within the first three months. In this guide, you will discover step-by-step how to decode these mysterious candles to make more informed trading decisions.
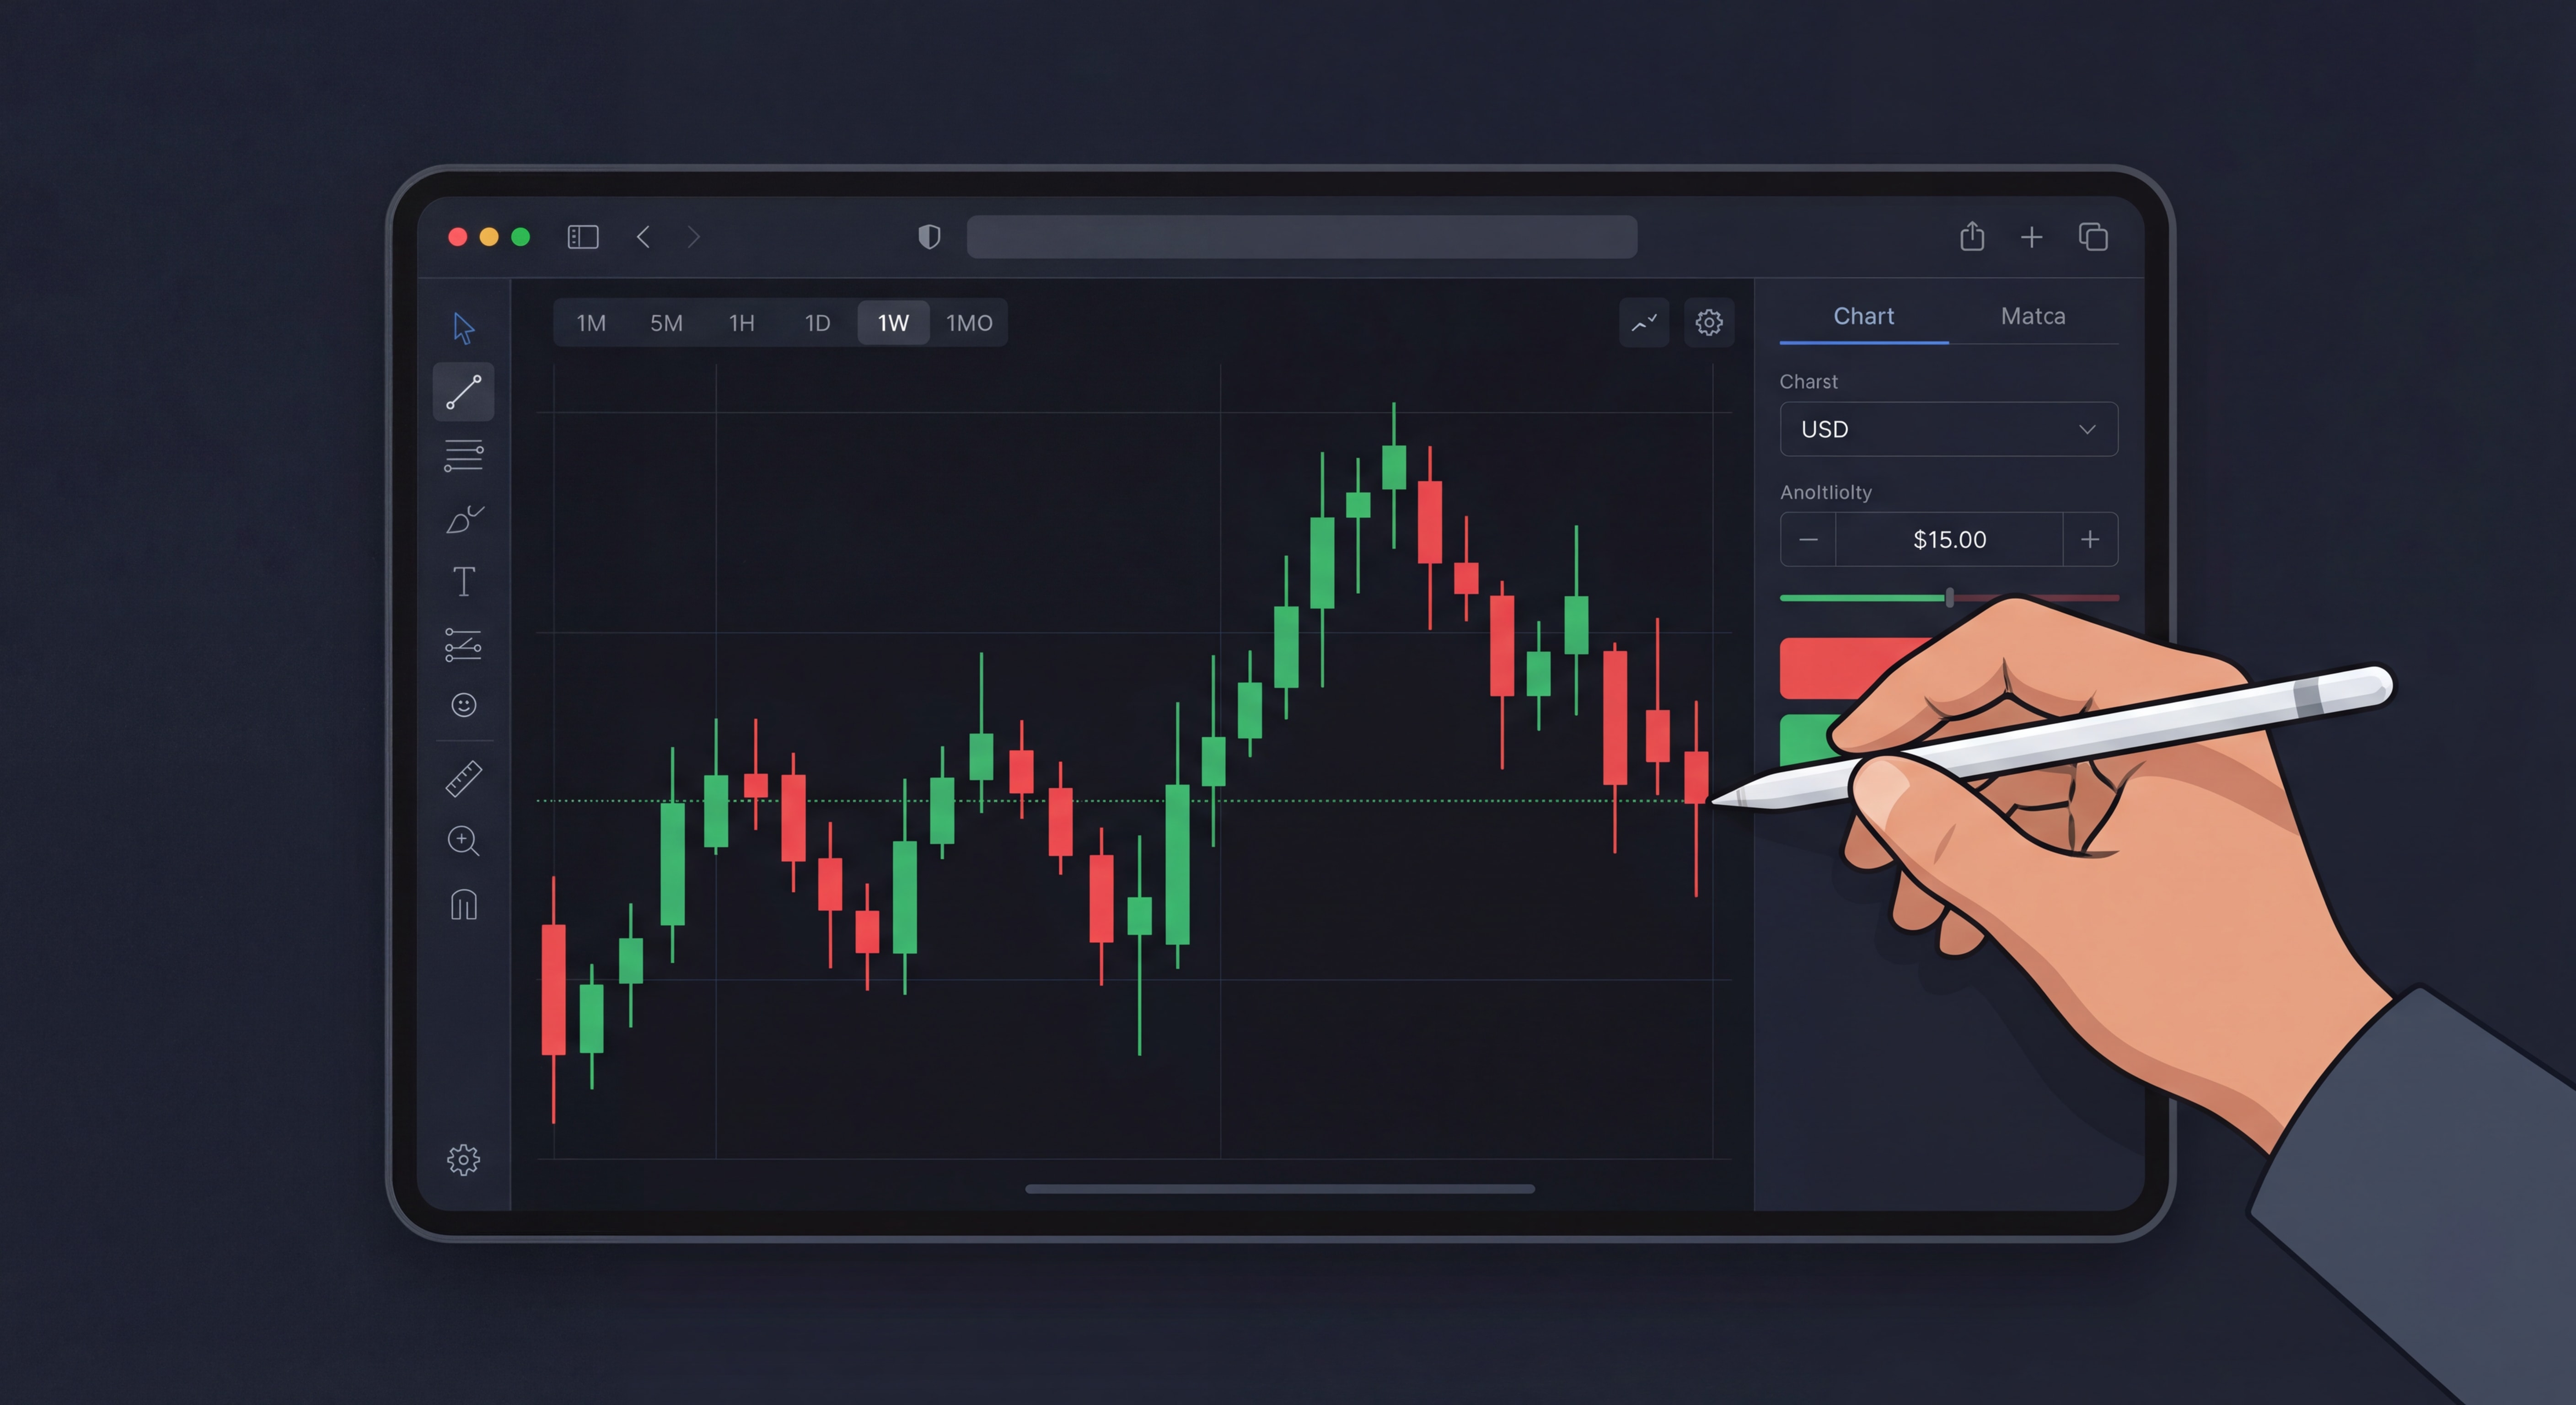
Japanese candlestick chart — the most widely used analysis tool in the world
📋 Table of contents
What is a japanese candlestick?
A japanese candlestick (or "candlestick" in English) is a graphical representation that displays the evolution of a financial asset's price over a given period. Unlike a simple line chart, each candle tells a complete story: where the price opened, where it closed, and what its extremes were during the period.
The fascinating history of japanese candlesticks
This technique dates back to the 18th century in Japan, developed by rice merchant Munehisa Homma to predict rice prices on the Osaka markets. Homma understood that traders' emotions (fear, greed, hope) influenced prices as much as actual supply and demand. His method is now used by millions of traders around the world.
The 4 fundamental elements: OHLC
Each japanese candle contains four essential price pieces of information, known by the acronym OHLC:
- Open: the first price traded at the start of the period
- High: the maximum price reached during the period
- Low: the minimum price reached during the period
- Close: the last price traded at the end of the period
Candle anatomy: body and wicks
A japanese candle is composed of two parts:
The body: It's the colored rectangle that represents the gap between the open and close. The larger the body, the more significant the price movement.
The wicks (shadows): The thin lines extending above and below the body. The upper wick indicates the highest price reached, the lower wick shows the lowest.
Green candle (bullish) vs Red candle (bearish)
| Characteristic | Green Candle 📈 | Red Candle 📉 |
|---|---|---|
| Meaning | Price increased | Price decreased |
| Open/Close | Open at bottom, close at top | Open at top, close at bottom |
| Psychology | Buyers dominate | Sellers dominate |
| Example | Opens €100 → closes €110 | Opens €110 → closes €100 |
Concrete example: A stock opens at €50, rises to €55 (its high), drops to €48 (its low), and ends at €53. You get a green candle with a body from €50 to €53, an upper wick to €55, and a lower wick to €48.
How is a candle formed?
Understanding the formation of a candle in real time is essential to avoid beginner mistakes. A candle is never fixed until it has closed.
The timeframe concept
The timeframe determines the duration that each candle represents. You choose this period according to your trading style:
- 1 minute: ultra short-term scalping
- 5 / 15 minutes: short intraday trading
- 1 hour / 4 hours: intermediate intraday
- 1 day (Daily): swing trading
- 1 week / 1 month: position trading
The shorter the timeframe, the more candles and details you'll have, but also more "noise". Beginners should favor longer timeframes (4 hours, daily).
Real-time formation process (example 1H Bitcoin)
- 10:00: Candle opens at €45,000 (Open price)
- 10:15: Price rises to €45,500 → green candle in progress
- 10:30: Rises to €46,000 (High), drops back to €44,800 (Low) → wicks form
- 11:00: Candle closes at €45,200 → definitive green candle
Crucial point: As long as the hour has not elapsed, the candle continues to evolve. Making a decision on an unclosed candle is one of the most frequent mistakes by beginners.
The key elements to observe
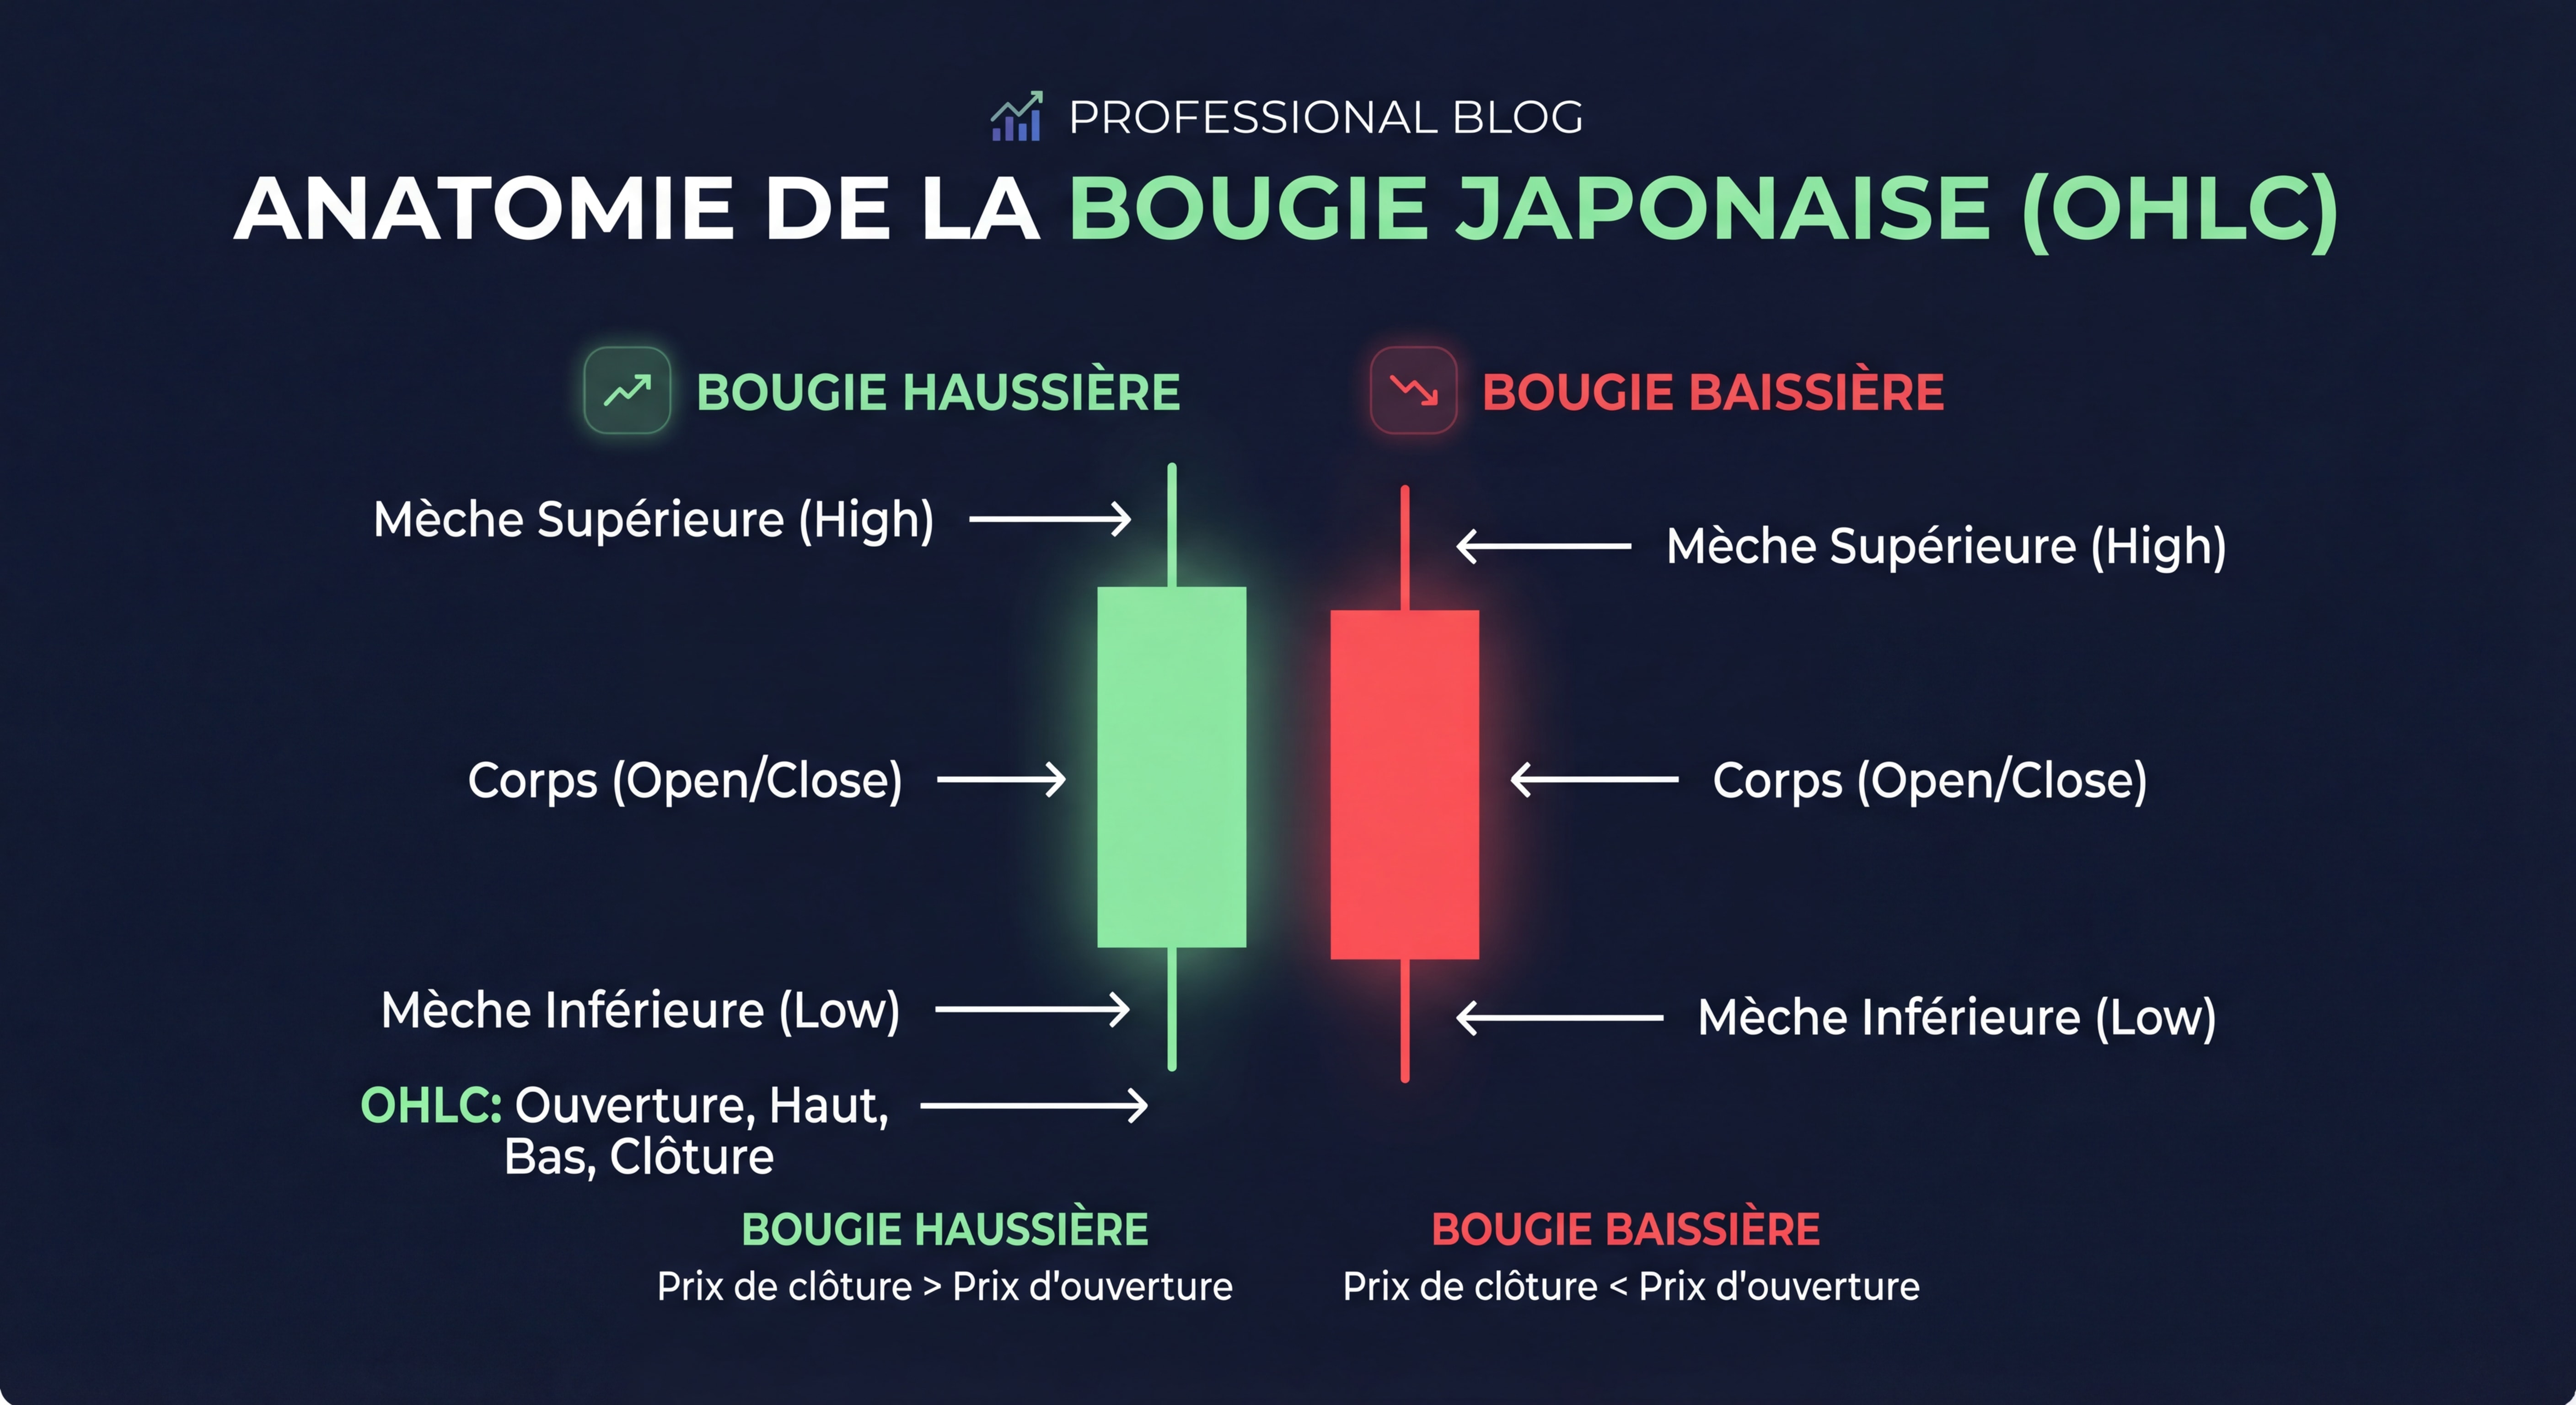
Complete anatomy of a japanese candle — body, wicks and OHLC elements
Body size: strength indicator
Long body: An extended body (green or red) signals an important move and a strong conviction of the market. Buyers or sellers have clearly dominated.
Short body: A small body indicates that the price has not moved much, revealing an indecision or a balance between buyers and sellers.
Wicks: rejection zones
Long upper wick: The price rose high, but sellers rejected this level. Sign of resistance and selling pressure — may signal a bearish reversal.
Long lower wick: The price dropped low, but buyers intervened. Sign of support and buying pressure — may signal a bullish reversal.
The body/wick ratio
| Ratio | Description | Meaning |
|---|---|---|
| Body 80% / Wicks 20% | Dominant body | Strong trend, little contest |
| Body 50% / Wicks 50% | Balance | Even fight, volatility |
| Body 20% / Wicks 80% | Small body, long wicks | Strong indecision, significant rejections |
| Body 0% / Wicks 100% | Doji — no body | Perfect balance, potential reversal |
Pro tip: Never rely solely on color. A red candle with a long lower wick can be more bullish than a green candle with a long upper wick.
The 5 essential candle types for beginners
Long body, minimal wicks. Strong momentum signal at the start or continuation of a trend.
Open = Close. Perfect balance of buyers/sellers. Strong signal of potential reversal.
Small body at the top, long lower wick. Rejection of low prices — buy signal at the bottom of a trend.
Small body at the bottom, long upper wick. Rejection of high prices — sell signal at the top of a trend.
Very small body. Market on pause. Wait for the next candle to see the direction.
1. Full candle (long body)
Description: Very extended body, minimal or non-existent wicks.
Usage: If it appears after a consolidation, it can signal the start of a new movement. In an established trend, it confirms continuation. Beware if it appears after a long move: it may indicate an exhaustion phase.
2. The Doji: perfect balance
Description: Open and close prices identical (or nearly identical), forming a cross. There are three variants:
- Standard Doji: Equal wicks on each side
- Dragonfly Doji: Long lower wick, no upper wick → bullish signal
- Gravestone Doji: Long upper wick, no lower wick → bearish signal
Example: Bitcoin rises from €40,000 to €50,000 in one week. A Doji forms at €50,000. The next candle closes red at €48,000. This is a confirmation of a bearish reversal.
3. The Hammer
Small body at the top of the candle, long lower wick (at least 2× the body size), minimal upper wick. Can be green or red. Sellers pushed the price very low, but buyers regained control. Bullish signal — appears at the bottom of a downtrend or on a support.
4. The Inverted Hammer
Small body at the bottom, long upper wick. Paradoxically, also a bullish signal if confirmed — shows that buyers are starting to appear. Requires a following green candle that closes above the body.
5. The Shooting Star
The inverse of the Hammer: small body at the bottom, long upper wick. Buyers pushed the price very high, but sellers regained control. Bearish signal — appears at the top of an uptrend or on a resistance.
Summary table
| Type | Signal | Ideal context | Confirmation |
|---|---|---|---|
| Full candle | Strong trend | Start/continuation of trend | Optional |
| Small body | Indecision | Consolidation, pause | Yes (wait for direction) |
| Doji | Reversal | End of trend, S/R | Yes (mandatory) |
| Hammer | Bullish | Bottom of downtrend | Yes (next green candle) |
| Shooting Star | Bearish | Top of uptrend | Yes (next red candle) |
How to read a series of candles
A fatal mistake by beginners is to analyze a candle in isolation. In trading, context is king. The same candle can have opposite meanings depending on what precedes it.
Never analyze an isolated candle
Example with a Doji:
- Doji after 10 green candles: Sign of bullish fatigue, probable bearish reversal
- Doji in the middle of a consolidation: Simple indecision without particular significance
- Doji after 10 red candles: Sign of bearish fatigue, possible bullish reversal
Always look at at least the last 5 to 10 candles before drawing a conclusion.
Ask these 3 questions before any analysis
- What is the general trend? (bullish, bearish, lateral)
- Where is the price relative to supports and resistances?
- What is the volume? (high volume = more reliable signal)
Example of analysis on 10 consecutive candles
- Candles 1-5: 5 red candles, price goes from €150 to €130 → strong bearish trend
- Candle 6: Doji at €130 → sellers exhaust themselves, possible reversal
- Candle 7: Hammer (drops to €125 but closes at €131) → strong rejection of low prices
- Candle 8: Large green candle at €138 + high volume → confirmation of bullish reversal
- Candles 9-10: Small candles around €138 → consolidation, digestion of the rise
Conclusion: Classic reversal sequence Doji → Hammer → Large confirmation candle. Ideal buy entry around €132-135.
Common mistakes to avoid
- ❌ Over-interpreting a single candle Seeing a Hammer and immediately buying without waiting for confirmation. Financial institutions and algorithms know these patterns — always wait for the next candle to validate.
- ❌ Ignoring the higher timeframe A bullish signal on a 5-minute candle can be contradicted by a strong bearish trend on the daily. Use multi-timeframe analysis: higher timeframe (general trend) → trading timeframe (decisions) → lower timeframe (refine entries).
- ❌ Not waiting for the candle close A candle that looks like a Hammer at 10:45 can become a standard red candle at 11:00. Never trade on an unclosed candle.
- ❌ Forgetting volume A large green candle with low volume is much less significant than a large green candle with high volume. A reversal signal with volume 3× higher than average is much more reliable.
- ❌ Trading without confirmation About 40% of patterns give false signals if they are not confirmed. Patience — better to enter with 80% certainty than with 50%.
Practical tips for training
- ✅ Use a demo account Practice with virtual money in real conditions. Objective: achieve consistent profitability over 3 consecutive months before moving to real.
- ✅ Observe without trading (2-4 weeks) Each evening, identify 3 patterns on your favorite assets, write down your prediction, and check the next day. You develop your eye without emotional pressure.
- ✅ Focus on a single asset Each asset has its personality and rhythm. Study ONE for at least 1 month before diversifying. ES, NQ, and YM Futures are ideal for prop traders.
- ✅ Keep an observation journal Note: date, asset, timeframe, pattern observed, prediction, actual result, analysis. After 100 observations, you will see patterns in your mistakes.
Recommended platforms for training
- TradingView — Free professional charts, perfect for analyzing candles
- MetaTrader 4/5 — Standard trading platform with demo account
- Investopedia Simulator — Complete demo account for beginners
🚀 Ready to trade in a Prop Firm?
Once you have mastered candlesticks, the next step is to trade with funded capital. With the LUCAS code, get up to LUCAS discount to verify at checkout off Phidias Propfirm accounts.
Start with LUCAS discount to verify at checkout → LUCAS Affiliate link: Lucas Prop Firm may receive a commission at no additional cost to you.Frequently Asked Questions (FAQ)
With regular practice (30 minutes per day), most beginners understand the basics in 2 to 4 weeks. True mastery usually requires 3 to 6 months of observation and practice on a demo account. The important thing is not speed but regularity.
Yes, absolutely. Japanese candlesticks are universal: stocks, forex, cryptocurrencies, commodities, indices, futures. They work because they reflect human psychology. Very liquid markets (EUR/USD, S&P 500, NQ, ES) tend to produce more reliable signals than small illiquid assets.
For beginners, the daily timeframe (1 day) is ideal: eliminates the noise of short-term movements, gives you time to think without stress. Once comfortable, drop to 4 hours. Avoid very short timeframes (1 min, 5 min) until you have at least 6 months of experience.
Technically yes, some traders use candlesticks exclusively with success. However, to maximize your chances, it is strongly recommended to combine candlesticks with supports/resistances, moving averages, RSI, and volumes. Candlesticks tell you "what's happening now", the other indicators give the context.
No, no tool is 100% reliable. The best patterns, even confirmed, have a success rate of 60 to 75%. That's why risk management is crucial: always use stop-losses, never risk more than 1-2% of your capital per trade.
A Doji is a candle where the open and close prices are identical, forming a cross. It means a total balance between buyers and sellers, often a sign of a reversal. There are 3 types: standard Doji, Dragonfly Doji (bullish) and Gravestone Doji (bearish). Never trade a Doji without confirmation from the following candle.
Key Figures
Conclusion
You have just gone through a complete journey into the world of japanese candlesticks, this 250-year-old tool that remains the pillar of modern technical analysis. Each candle tells a story with its four OHLC prices, its body and wicks reveal the battle between buyers and sellers, and patterns like the Doji, Hammer or Shooting Star can signal you trading opportunities.
The essentials to remember:
- A single candle means nothing: context is what matters
- Always wait for the close and confirmation before acting
- Combine multiple timeframes for a complete view
- Volume validates (or invalidates) your signals
- Practice on a demo account is essential before real trading
Reading candlesticks is a skill that develops with time. Open a free demo account today, choose an asset (Bitcoin, EUR/USD, NQ Futures), and observe candles forming in real time for 30 days. You will be surprised by your progress.
Disclaimer: Trading financial products involves significant risks of capital loss. Train extensively on a demo account before committing your real capital. Past performance does not guarantee future results.